- 16 Aug 2020
- Kevarnold
- Comments: 1
The DAX Pattern for dynamic segmentation is a great way to provide classifications on reports. This post will explore the requirements that took our solution from a static segmentation to the dynamic pattern.
tl;dr
The data and PowerBI files are on my github here
Initial Requirements
Our team received a feature request to add the ability to count projects which fit within different revenue bands. It would utilize the data in the Financial Subject Area within the Enterprise Data Warehouse (EDW). This static solution was initially implemented in a multi-dimensional cube and ported to a tabular model.
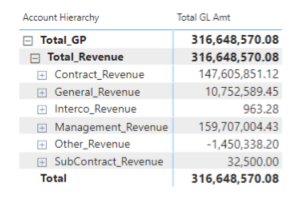
The financial subject area’s main fact table contains General Ledger (GL) transactions. Each transaction is assigned to a GL Account, which is held in an Account Hierarchy. The data in my example model is limited to Revenue accounts.
Static Pattern
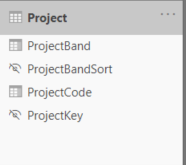
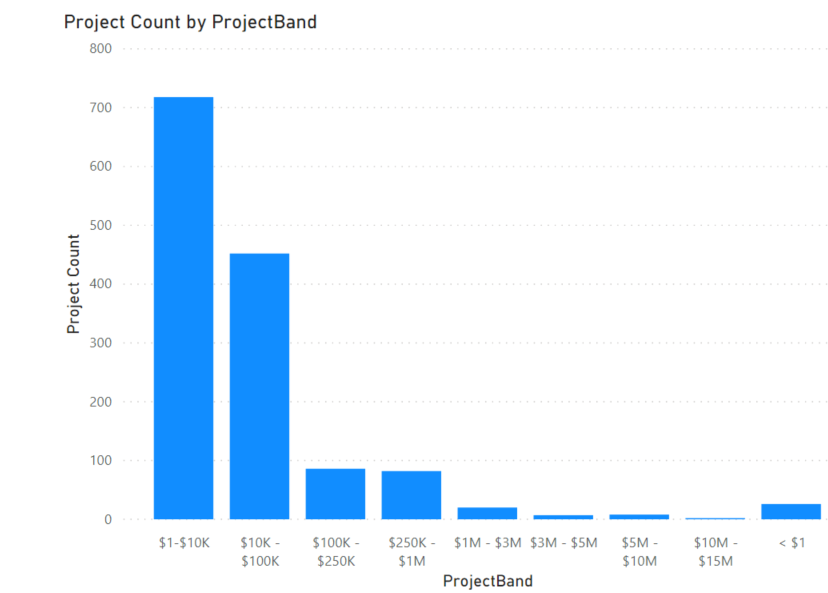
The implementation involved adding attributes to the project dimension that assigned the proper segment band and the sort value. It was accomplished by adding a step to the data pipeline process before the cube refresh. This was also ported over the tabular model as well, along with the project count measure. Here are the static columns in the model and an example report.
Note: When you download and review the data, you might notice that some of the projects are not correctly banded. My process of producing the test data has a bug, but I decided not to correct it to make a point. When using a method that generates columns, you are adding logic that might need to change along with other data transformation changes. Therefore, the logic for this requirement is better placed in the model to avoid the issue.
Dynamic Pattern
This static approach worked well for the initial reporting in both the cube and our initial conversion to the tabular model. Then the business asked to have multiple band groups and to only include the revenue for the selected department.
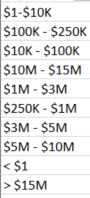
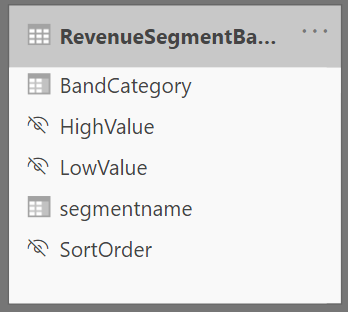
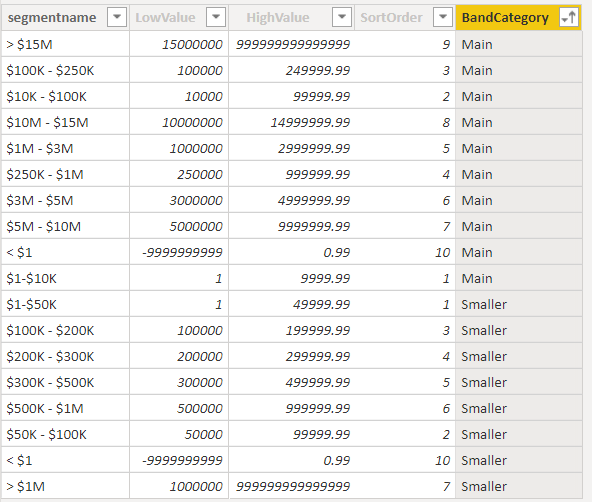
The first step in accomplishing this is adding a Revenue Segment Bands disconnected table. This table defines the segment name, the category it is in and the upper and lower limits
The measure to produce the Project count by segment is added next. This is the DAX for that measure.
Segment Project Count = VAR ProjectsInSegment =
    FILTER (
        ALLSELECTED ( Project ),
        VAR TotalProjectRevenue = [Total Revenue]
        VAR RevenueSegment =
            FILTER (
                'RevenueSegmentBands',
                NOT ISBLANK ( TotalProjectRevenue )
         && TotalProjectRevenue >= 'RevenueSegmentBands'[LowValue]
         && TotalProjectRevenue < 'RevenueSegmentBands'[HighValue]
            )
        VAR IsProjectInSegments =
            NOT ISEMPTY ( RevenueSegment )
        RETURN
            IsProjectInSegments
    )
VAR Result =
    CALCULATE ( [Project Count], KEEPFILTERS ( ProjectsInSegment ) )
RETURN
    Result
The logic can be explained as – Produce a table variable for the selected projects in the range for the select segment band. This table is used as a filter on the result calculation. The complete solution allows us to produce this visual, using the segment name as a slicer/grouping.
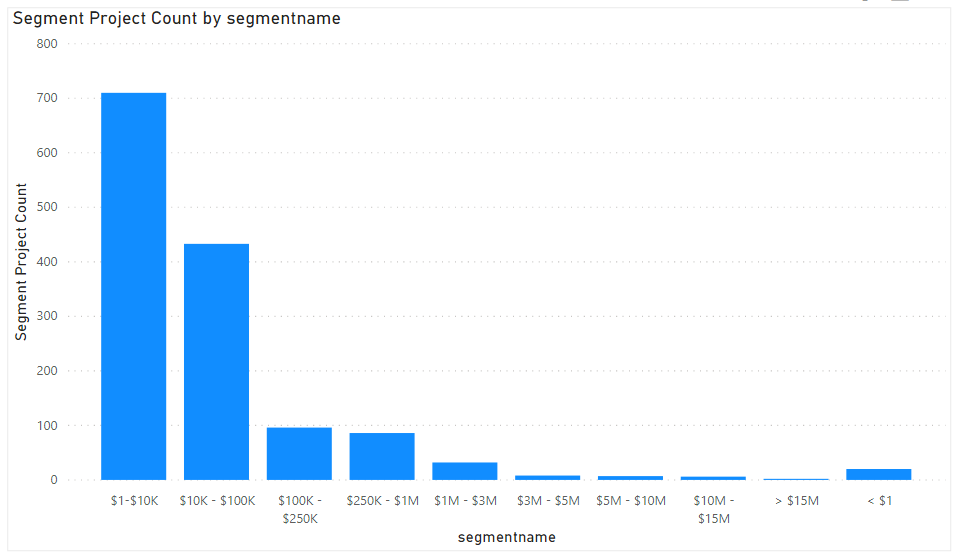
The Revenue Segment band table has a column that groups different sets of bands and is used to switch between them. The measure allows for the total revenue to be filtered by the other dimensions in the model. This can be explored in the downloadable model.
Very good explanation. I like the graphics showing the end result.