- 08 Sep 2020
- Kevarnold
- Comments: 0
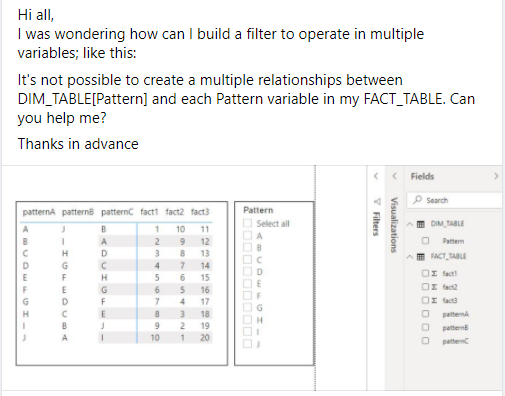
The question in the image below came from the Global Power BI User Group on Facebook. It seemed better to answer with a quick blog post to provide more detail.
tl;dr
The data and Power BI model can be downloaded from my githup here
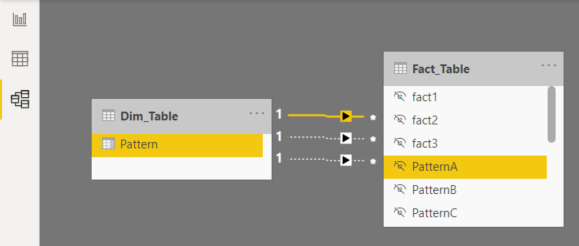
This example can be solved with multiple relationships between the FACT and DIM table. Only one relationship will be active, the others will require the DAX function USERELATIONSHIP in the measure.
Let us start with the data model. The DIM table is related to the FACT table three times. Once each for PatternA, PatternB, and PatternC. The active relationship, which is highlighted, is from PatternA to Pattern. The other two are inactive relationships, indicated by the dotted lines. The active relationship will be used by default in the DAX calculations.
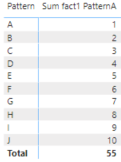
As an example, this calculation will be based upon the active relationship when the Dim table is included in the visual.
Sum fact1 PatternA = SUM(Fact_Table[fact1])
The results will be:
Additional measures would be added to perform the calculations using the other relationships. For example:
Sum fact1 PatternB = CALCULATE (
               SUM ( Fact_Table[fact1] ),
               USERELATIONSHIP ( Fact_Table[PatternB], Dim_Table[Pattern] )
)
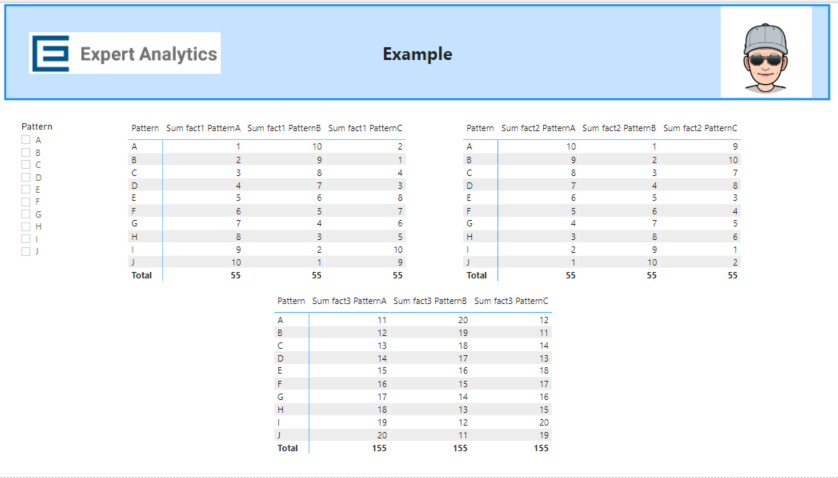
This pattern would be repeated for each of the fact columns in the fact table. Here is what a simple visulazation could look like. You can download the model to experiment.